|
From last December to this January,
RENGO conducted its "3rd Emergency Employment Survey"
with 4423 RENGO-affiliated unit unions from private sector responding.
Survey
Results (Summary)
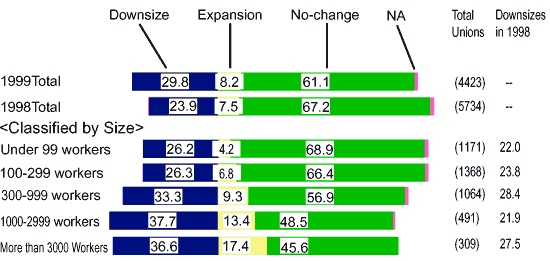
1. Changes in Business Size
Overall, 29.8% of all companies "downsized" and 61.1%
posted "no change." When compared with the last survey,
"downsizing" increased by 6 points, while "expanding"
companies or those with "no change" actually decreased
.
A breakdown by industry reveals some striking differences. "Downsizing"
was relatively high in chemical and textile, transportation,
metal, and the construction/materials/forestry industries, while
"expanding" was relatively high in the commerce, distribution,
wholesale/retail sales, information, publishing, resources &
energy, and foodstuffs industries. The sharp eighteen-point increase
in the information, publication industry and ten-point increase
for the resource/energy industry was especially significant.
A breakdown of businesses by scale reveals that businesses have
a greater tendency to "Downsize or Expand" the larger
they become.
Out of a total of 30.4% of all businesses with less than 99 workers
that changed size 26.2% downsized and 4.2% expanded. On the other
hand, out of 54.4% of all businesses with more than 3000 workers,
36.6% downsized and 17.8% expanded.
It is apparent that the larger a business becomes the chances
for "downsizing" or "expanding" also become
greater. We can find strong diversity by business size.
(Chart) Changes in Business
Size
2. Changes in Number of
Workers
(1) Permanent Employees
56.6% replied that the number of permanent workers "decreased"
while 32.6% replied "no change."
Compared to the last survey, the number that "decreased"
raised 8 points and consequently those that "increased"
or showed " no change" dropped.
Classified by industry, a comparatively large number of financial/insurance
and chemical/textile industries "downsized" their number
of workers. On the other hand, unions that reported to have "increased"
the number of workers in the information/publication industries
were relatively high. Especially prominent among industries that
"decreased" was the financial/insurance industry which
recorded a massive drop of approximately 16 points.
Classified by scale, the larger the business the higher "the
rate of staff downsizing" was a trend that saw greater increases.
Businesses with less than 99 workers marked a 46.8% reduction
in the number of staff, while businesses with more than 3000
workers recorded a 72.8% reduction.
Examining the relevancy between employment adjustment and the
change in the number of permanent workers, when businesses had
"no employment adjustment" 45.3% registered "no
change" in the number workers. However, when there were
adjustments, the number of "workers reduced" was roughly
70 to 90%.
(2) Part-time/Temporary Staff
26.1% of the unions reported an increase in part-time/temporary
workers, 25.0% showed a decrease, and 44.2% remained unchanged.
Divided by business, one can find a relatively high rate of "downsizing"
in chemical/textile and metal industries, while "increases"
in part-time/temporary staff was fairly high in the financial/insurance,
commerce/distribution/wholesale & retail sales, transportation,
foodstuffs, and general service industries. Results varied greatly
by industry.
When classified by business size, the possibility for increases
and decreases were proportionately larger the bigger a business
became. 19.4% of businesses with under 99 workers marked a "decrease
in part-time/temporary staff," 19.6% "increased,"
for a total of 39.0%. However, 29.1% businesses with more than
3000 workers marked a decrease, while 30.7% showed an "increase"
for a total of 59.8%. This survey illustrates a simultaneous
progress in both increases and decreases of part-time/temporary
workers.
3. Actual Conditions of
Employment Adjustment
(1) Details of Employment Adjustments
Conducted Last Year
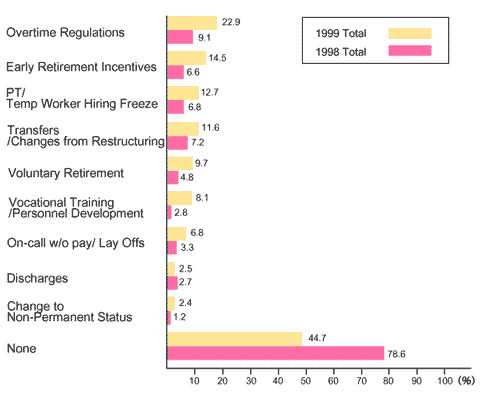
While the overall figure for "No employment adjustments"
remained at 44.7%, this figure is massive down approximately
28 points from the last survey.
The most common employment adjustments were "overtime regulations,"
followed by "early retirement incentives," "hiring
freezes of part-time/temporary workers," and "temporary
transfers/change due to business restructuring." With the
exception of "discharges," most of the items doubled
compared to the last survey.
(Chart) Details of Employment
Adjustments Last Year (multiple answers)
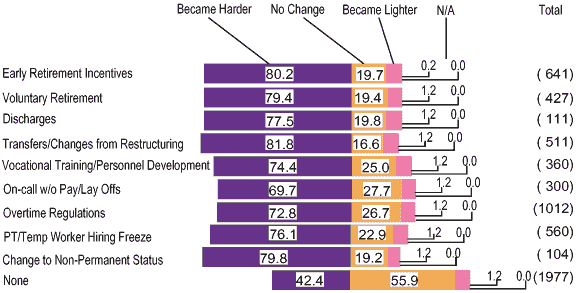
4. Trends in Duty Conditions
(1) Workload per Worker
The survey showed 58.2% answered that fluctuations in the number
of personnel made the workload "too hard," whereas
40.5% replied there was "no change."
Those who responded the workload became "harder" increased
approximately 12 points compared to the last survey. Accordingly,
respondents who said there was "no change" in the workload
or that it became "lighter" decreased.
On an industry level, approximately 60 to 70% of those in the
finance/insurance, commerce/ distribution/wholesale & retail,
chemical/textile and food industries replied that the workload
"became harder." Similar responses from those in the
construction/material/forestry industry showed a sizable increase
of about 16 points.
On a business scale level, the larger the industry, the greater
number of responses that the workload had become "harder."
46.3% of businesses with less than 99 workers thought the workload
had increased, but that number jumped up to 78% for businesses
with more than 3000 workers. This survey reveals a tendency for
higher workloads primarily in bigger companies.
When we analyze the relevance between employment adjustments
and workload changes, 55.9% of businesses that made no employment
adjustments showed "no change" while approximately
70 to 80% of the businesses that made employment adjustments
reported that the workload "became harder."
Taken together, this shows that employment adjustments, when
they involved personnel cuts tended to elicit a higher percentage
of "higher workload" responses. As described above
in the individual worker's responsibilities section, personnel
cuts included "changes to non-permanent status," "temporary
employment transfers/changes from business restructuring,"
"early retirement incentives," "voluntary retirement,"
"discharges," and so forth.
(Chart) Workload per Person
(compared to last year)
5. Influences of the Industrial
Revitalization Special Measures Law
(1) Trends in Business Organizational
Changes
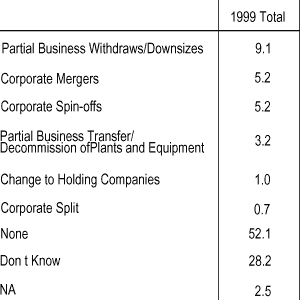
52.1% of the respondents recorded "no organizational changes"
while 24.4% reported they "suffered change" (multiple
answers). However, 28.2% said they "don't know," which
indicates that we still do not have a sufficient grasp of trends
at the moment.
"Business organizational changes" include "partial
business withdrawals/downsizes" which is the most popular
one, followed by "corporate mergers" "corporate
spin-offs" "partial business transfers/decommission
of plants and equipment."
Classified by industry, "don't know" answers were high
in the construction/material/forestry, foodstuffs, and general
service industries, while "none" answers were common
in the resource/energy, and "business mergers" in the
finance/insurance industry. Results differ significantly by industry.
Based on scale, the larger the company, the higher the frequency
of "partial business withdrawals/downsizes" and "corporate
spin-offs." However, "none" and "don't know"
answers decrease as companies become bigger. Conditions vary
largely on size.
(Chart) Trends in Business Organizational
Changes (multiple answers)
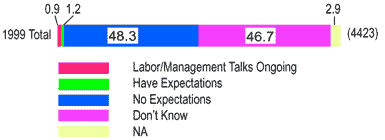
(2) Expectations for Filing the "Business Reorganization
Plan"
Regarding their expectations for filing the "Business Reorganization
Plan," 48.3% answered that they had "no expectations."
One the other hand, 0.9% answered that "yes, labor/management
are talking" and 1.2% "expected" to for a total
of 2.1%. However, there were 46.7% "don't know" answers.
The survey shows that future tends are indeed hard to grasp.
There were no particular differences between industries or sizes,
with almost all of them sharing common tendencies.
(Chart) Expectations for Filing
the "Business Reorganization Plan"
|